Copyright © 2026
Rockhaven Resources
All rights reserved.
Rockhaven Resources
All rights reserved.
686,000 Indicated and 507,000 Inferred Gold Ounces
June 21, 2018 - Rockhaven Resources Ltd. (TSX-V:RK) (“Rockhaven”) is pleased to announce updated Mineral Resource estimates for the high-grade Western BRX, Central BRX, Central Klaza, and Western Klaza zones at its 100%-owned and road accessible Klaza property, located in the Dawson Range Gold Belt of southern Yukon.
The updated Mineral Resource estimates incorporate results from approximately 13,300 m of in-fill and expansion diamond drilling completed subsequent to the 2015 Mineral Resource estimate, and utilizes results from recent metallurgical test work to revise cut-off grades. Bulk tonnage low-grade mineralization in the Eastern Zones requires additional sampling, drilling and modeling, and is not included in these Mineral Resource estimates.
Highlights from this news release include:
Table 1: Mineral Resource Estimate Summary, June 5, 20181,5
| Tonnes | Grade | Contained Metal | |||||||||
|---|---|---|---|---|---|---|---|---|---|---|---|
| Au | Ag | Pb | Zn | AuEQ4 | Au | Ag | Pb | Zn | AuEQ4 | ||
| (kt) | (g/t) | (g/t) | (%) | (%) | (g/t) | (koz) | (koz) | (klb) | (klb) | (koz) | |
| Indicated3 | 4,457 | 4.8 | 98 | 0.7 | 0.9 | 6.3 | 686 | 14,071 | 73,268 | 92,107 | 907 |
| Inferred3 | 5,714 | 2.8 | 76 | 0.6 | 0.7 | 3.9 | 507 | 13,901 | 77,544 | 89,176 | 725 |
1 CIM Definition Standards (2014) were used for reporting the Mineral Resources. Using drilling results to December 31, 2017. The Qualified Persons are Adrienne Ross, P.Geo. of AMC Mining Consultants (Canada) Ltd, and Nicholas Ingvar Kirchner, FAusIMM, MAIG. of AMC Mining Consultants Pty Ltd.
2 Near surface Mineral Resources are constrained by an optimized pit shell at a metal prices of $1,400/oz Au, $19/oz Ag, $1.10/lb Pb, and $1.25/lb Zn.
3 Cut-off grades applied to the pit-constrained and underground resource are 1.0 g/t and 2.3 g/t AuEQ respectively.
4 Gold equivalent values assume $1,400/oz Au, $19/oz Ag, $1.10/lb Pb, and $1.25/lb Zn, and variable recoveries for the different metals.
5 Numbers may not add up due to rounding. Mineral Resources that are not Mineral Reserves do not have demonstrated economic viability. All metal prices are quoted in US$ at an exchange rate of $0.80 US to $1.00 Canadian.
“The Klaza project hosts high-grade gold and silver resources that are near surface, road accessible and located within one of the safest mining jurisdictions in the world,” stated Matt Turner, CEO of Rockhaven Resources. “We have upgraded much of our Inferred Mineral Resource to the Indicated category for $4 per oz gold or at a rate of 52 oz gold per metre drilled.* Additionally, the conversion of high-grade resources from underground to open pittable should have major economic benefits for the project.”
The following table reports the Mineral Resources by potential mining method.
Table 2: Mineral Resource Estimate by mining method, June 5, 20181,5
| Category | Tonnes | Grade | Contained Metal | ||||||||
|---|---|---|---|---|---|---|---|---|---|---|---|
| Au | Ag | Pb | Zn | AuEQ4 | Au | Ag | Pb | Zn | AuEQ4 | ||
| (kt) | (g/t) | (g/t) | (%) | (%) | (g/t) | (koz) | (koz) | (klb) | (klb) | (koz) | |
| Indicated | |||||||||||
| Pit-Constrained2,3 | 2,447 | 5.3 | 90 | 0.7 | 1.0 | 6.7 | 414 | 7,096 | 39,143 | 52,935 | 529 |
| Underground3 | 2,010 | 4.2 | 108 | 0.8 | 0.9 | 5.8 | 272 | 6,974 | 34,125 | 39,172 | 378 |
| Total | 4,457 | 4.8 | 98 | 0.7 | 0.9 | 6.3 | 686 | 14,071 | 73,268 | 92,107 | 907 |
| Inferred | |||||||||||
| Pit-Constrained2,3 | 1,754 | 2.6 | 43 | 0.4 | 0.5 | 3.3 | 147 | 2,429 | 14,897 | 18,599 | 187 |
| Underground3 | 3,960 | 2.8 | 90 | 0.7 | 0.8 | 4.2 | 359 | 11,472 | 62,647 | 70,578 | 538 |
| Total | 5,714 | 2.8 | 76 | 0.6 | 0.7 | 3.9 | 507 | 13,901 | 77,544 | 89,176 | 725 |
* See footnotes under Table 1
About the Klaza Deposit
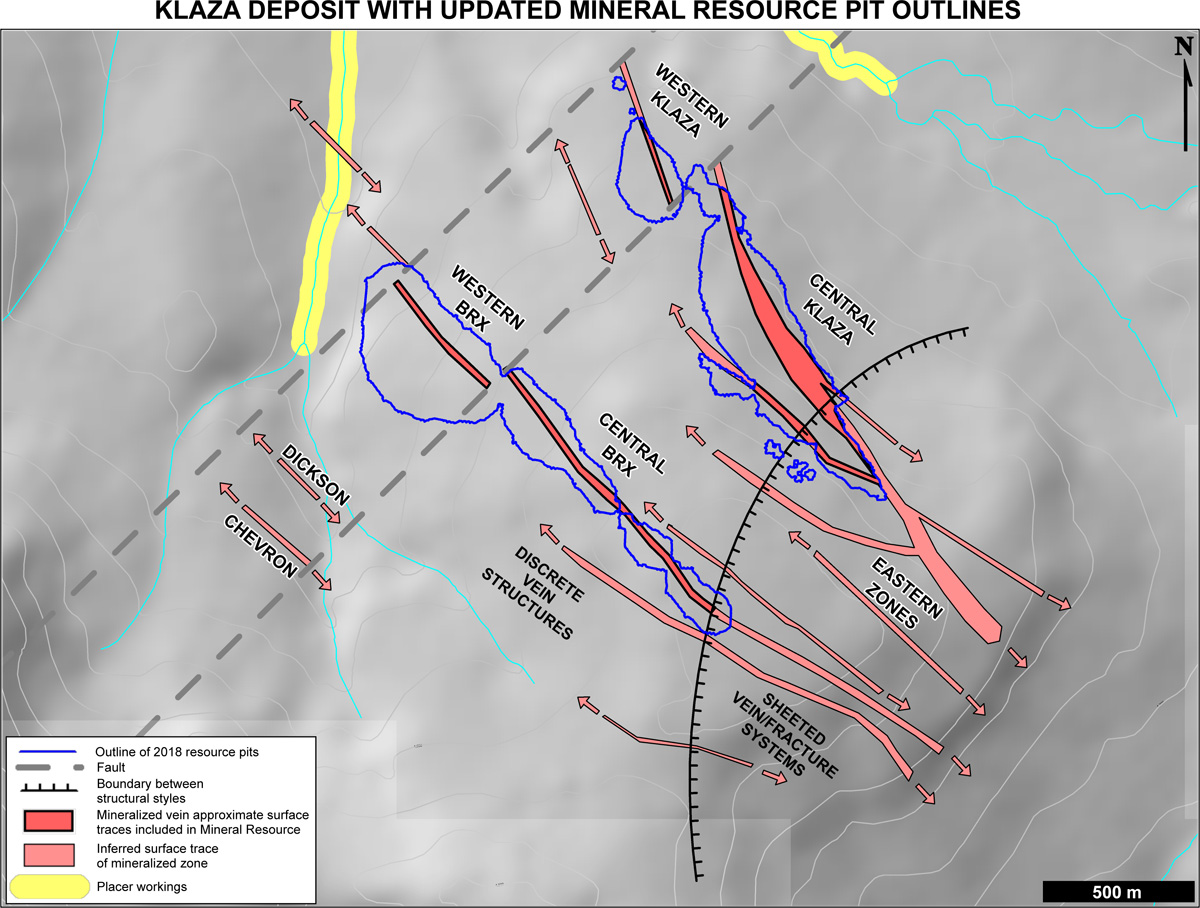
The Klaza project hosts a large hydrothermal system that is concentrated within a 4 km long by 3 km wide structural corridor. Current Mineral Resource areas have only been systematically explored to about 275 m below surface, but well mineralized intersections occur as deep as 450 m. Eleven known mineralized zones have been identified within the corridor and all are open for expansion along strike and to depth. The deposit model for the Klaza deposit suggest the zones could be well mineralized to depths of 1,000 m or more below surface.
In spring 2016, Rockhaven completed a Preliminary Economic Assessment (PEA) of the Klaza property in order to demonstrate project viability and recognize key economic sensitivities. The PEA identified several opportunities to improve future economics, including:
In 2016 and 2017, Rockhaven completed 13,291 m of infill and expansion diamond drilling, within and near to the 2015 Mineral Resources. This drilling successfully demonstrated the continuity of high-grade structures and identified much higher-grade areas within the known vein zones. Examples of these high-grade intersections include 182 g/t gold and 231 g/t silver over 0.61 m in Central Klaza; and, 94 g/t gold and 545 g/t silver over 2.63 m in Western BRX. The drilling also outlined lower-grade mineralization in the hanging wall and footwall of the Central Klaza Zone, and provided material for metallurgical testing.
The eastern portion of the Klaza vein system (Eastern Zones) comprises multiple, sub-parallel veins and veinlets, and includes the Eastern Klaza, Eastern BRX, Pika, Stroshein, and part of the AEX zones. All of these zones are open to the east, towards the mostly untested Kelly Porphyry. Previously, these zones were assumed to be similar to the discreet high-grade vein zones to the west (Western and Central portions of the BRX and Klaza) and were sampled, targeted and modeled using this assumption. The recent drilling and metallurgical test work have demonstrated that the mineralization is structurally, mineralogically and metallurgically different from the western zones. This area has bulk tonnage potential and requires additional sampling, drilling and modelling before a Mineral Resource estimate can be finalized.
Metallurgical testwork completed in 2017 demonstrates that dense media separation is effective in the Central Klaza, Western BRX, and Eastern zones (see Rockhaven news release dated April 19, 2018). This test work also showed that the Eastern Zones responded well to direct cyanide leaching. The new processing techniques identified by the test work allow for lower cut-off grades to be applied to the current Mineral Resource estimates. The application of pre-concentration should allow for less selective, lower cost mining methods in both underground and open pit workings in future economic studies.
Next Steps
The current Mineral Resource estimates and recent metallurgical test work have highlighted multiple priority targets for further resource expansion and definition. These include:
Resource Methodology
The 2018 Mineral Resource estimate was reported by AMC Mining Consultants (Canada) Ltd. and AMC Mining Consultants Pty Ltd. (AMC) and estimated using a combination of Ordinary Kriging (OK), Localized Multiple Indicator Kriging (LMIK) and restricted Ordinary Kriging (ROK).
The estimates were based on a revised geological model which included 2016 and 2017 drilling. Mineralization wireframes were constructed by Archer, Cathro & Associates (1981) Limited using GEMS software for the Central BRX, Western BRX, Central Klaza and Western Klaza areas based on lithological, structural and assay data. In total, 25 separate wireframes were constructed that modeled zones of continuous mineralization.
AMC completed an OK estimate on these domains. Prior to estimation, drillhole data was composited to 1 m and samples were capped for all variables within each domain where required.
In addition to the OK estimate, a broad mineralized envelope was constructed by AMC to encompass mineralization in parts of the Central Klaza zones where mineralization comprises closely spaced narrow veins, around which it is difficult to construct wireframes. These envelopes were constructed assuming a nominal 0.3 g/t gold boundary to define the outer limits of these systems, and exclude vein zones defined by the high-grade wireframes.
LMIK was used to estimate gold and silver Mineral Resources and ROK for other elements within the mineralized envelope. Samples were composited to 3 m within these envelopes.
A parent block dimensions of 25 mE x 12.5 mN x 5 mRL was assumed for the Klaza Block model. Indicator thresholds were selected based on the geostatistical characteristics of each domain, and were selected to discretize the profiles at slope changes and key grade thresholds. The indicator estimates were modified with a change of support correction to emulate a selective mining unit (SMU) scale mining block for moderate-scale, selective open pit mining on 5 m benches, and assessment for potential underground mining. The resultant MIK estimates were localized for the final LMIK model into SMU blocks having dimensions of 6.25 mE x 3.125 mN x 5 mRL.
Densities of individual blocks were calculated using a regression formula based on recorded density measurements and iron, lead, zinc and copper grades.
Tables showing the Mineral Resource for each zone included can be found below and on Rockhaven’s website at www.rockhavenresources.com.
Metallurgy
The Mineral Resource estimate has been prepared using results from recent metallurgical testwork, (see Rockhaven news release dated April 19, 2018). Dense media separation has been shown to be effective in the Western BRX and Central Klaza zones.
Qualified Persons
The Mineral Resource estimate was completed by AMC.
The OK Mineral Resource estimate disclosed in this press release for the Klaza Project have been prepared by Dr. A. Ross, P.Geo., an employee of AMC Mining Consultants (Canada) Ltd., who is independent of Rockhaven and a “Qualified Person” for the purpose of National Instrument 43-101. Dr. Ross has read and approved the content of this press release as it pertains to the disclosed Mineral Resource estimate.
The LMIK and ROK Mineral Resource estimate disclosed in this press release for the Klaza Project have been prepared by Mr Nicholas Ingvar Kirchner, an employee of AMC Mining Consultants Pty Ltd., who is independent of Rockhaven and a “Qualified Person” for the purpose of National Instrument 43-101. Mr Kirchner has read and approved the content of this press release as it pertains to the disclosed Mineral Resource estimate.
All other technical information in this news release has been approved by Matthew R. Dumala, P.Eng., a geological engineer with Archer, Cathro & Associates (1981) Limited and qualified person for the purpose of National Instrument 43-101.
Further details supporting the geological model, estimation procedure and metallurgical testwork will be available in a National Instrument 43-101 Technical Report. The report will be posted under the Rockhaven profile at www.sedar.com within 45 days from the date of this news release.
* Costs to upgrade the Mineral Resources from inferred to indicated was calculated using a cumulative exploration cost for the Klaza Project of $2,793,000 based on 13,291 m of infill drilling at an average cost of $210/m. Costs included drilling, assays, labour, camp costs, fuel, general camp consumables and winter office work.
About Rockhaven
Rockhaven Resources Ltd. is a mineral exploration company focused on growth through the advancement of its Klaza project. For additional information concerning Rockhaven or its Klaza project please visit Rockhaven’s website at www.rockhavenresources.com.
Matthew Turner
President, CEO and Director
Rockhaven Resources Ltd.
T:604-687-2522
mturner@rockhavenresources.com
Neither the TSX Venture Exchange nor its Regulation Services Provider (as that term is defined in the policies of the TSX Venture Exchange) accepts responsibility for the adequacy or accuracy of this release.
This news release may contain forward looking statements based on assumptions and judgments of management regarding future events or results that may prove to be inaccurate as a result of exploration and other risk factors beyond its control, and actual results may differ materially from the expected results.
Table 4: Western BRX Mineral Resource Estimate, June 5, 20181,5
| Tonnes | Grade | Contained Metal | |||||||||
|---|---|---|---|---|---|---|---|---|---|---|---|
| Au | Ag | Pb | Zn | AuEQ4 | Au | Ag | Pb | Zn | AuEQ4 | ||
| (kt) | (g/t) | (g/t) | (%) | (%) | (g/t) | (koz) | (koz) | (klb) | (klb) | (koz) | |
| Indicated | |||||||||||
| Pit-Constrained2,3 | 759 | 9.5 | 109 | 0.9 | 1.0 | 11.2 | 232 | 2,671 | 15,312 | 16,201 | 273 |
| Underground3 | 510 | 6.7 | 122 | 0.9 | 1.1 | 8.5 | 110 | 2,001 | 10,341 | 11,920 | 140 |
| Total (Indicated) | 1,269 | 8.4 | 115 | 0.9 | 1.0 | 10.1 | 341 | 4,672 | 25,653 | 28,120 | 414 |
| Inferred | |||||||||||
| Pit-Constrained2,3 | 369 | 4.7 | 54 | 0.5 | 0.6 | 5.6 | 56 | 644 | 3,915 | 4,884 | 67 |
| Underground3 | 974 | 3.7 | 93 | 0.7 | 0.9 | 5.2 | 116 | 2,906 | 16,044 | 19,976 | 162 |
| Total (Inferred) | 1,343 | 4.0 | 82 | 0.7 | 0.8 | 5.3 | 172 | 3,550 | 19,958 | 24,859 | 228 |
* See footnotes under Table 1
Table 5: Central BRX Mineral Resource Estimate, June 5, 20181,5
| Tonnes | Grade | Contained Metal | |||||||||
|---|---|---|---|---|---|---|---|---|---|---|---|
| Au | Ag | Pb | Zn | AuEQ4 | Au | Ag | Pb | Zn | AuEQ4 | ||
| (kt) | (g/t) | (g/t) | (%) | (%) | (g/t) | (koz) | (koz) | (klb) | (klb) | (koz) | |
| Indicated | |||||||||||
| Pit-Constrained2,3 | 289 | 2.9 | 150 | 0.8 | 1.3 | 5.1 | 27 | 1,396 | 5,029 | 8,141 | 47 |
| Underground3 | 424 | 1.9 | 106 | 1.0 | 1.1 | 3.6 | 26 | 1,443 | 9,793 | 10,171 | 50 |
| Total (Indicated) | 713 | 2.3 | 124 | 0.9 | 1.2 | 4.2 | 53 | 2,838 | 14,822 | 18,312 | 97 |
| Inferred | |||||||||||
| Pit-Constrained2,3 | 238 | 1.9 | 99 | 0.7 | 0.8 | 3.4 | 15 | 760 | 3,795 | 3,993 | 26 |
| Underground3 | 1,187 | 1.7 | 102 | 1.0 | 0.9 | 3.3 | 64 | 3,896 | 26,215 | 23,401 | 126 |
| Total (Inferred) | 1,425 | 1.7 | 102 | 1.0 | 0.9 | 3.3 | 79 | 4,656 | 30,010 | 27,394 | 152 |
* See footnotes under Table 1
Table 6: Western Klaza Mineral Resource Estimate, June 5, 20181,5
| Tonnes | Grade | Contained Metal | |||||||||
|---|---|---|---|---|---|---|---|---|---|---|---|
| Au | Ag | Pb | Zn | AuEQ4 | Au | Ag | Pb | Zn | AuEQ4 | ||
| (kt) | (g/t) | (g/t) | (%) | (%) | (g/t) | (koz) | (koz) | (klb) | (klb) | (koz) | |
| Indicated | |||||||||||
| Pit-Constrained2,3 | 139 | 4.8 | 234 | 0.8 | 0.9 | 7.8 | 21 | 1,043 | 2,388 | 2,722 | 35 |
| Underground3 | 361 | 4.0 | 181 | 0.6 | 0.7 | 6.4 | 47 | 2,099 | 4,440 | 5,773 | 74 |
| Total (Indicated) | 500 | 4.2 | 195 | 0.6 | 0.8 | 6.8 | 68 | 3,142 | 6,828 | 8,495 | 109 |
| Inferred | |||||||||||
| Pit-Constrained2,3 | 2 | 1.8 | 118 | 0.3 | 0.6 | 3.3 | 0 | 8 | 12 | 26 | 0 |
| Underground3 | 227 | 3.9 | 170 | 0.5 | 0.8 | 6.1 | 28 | 1,240 | 2,440 | 3,817 | 44 |
| Total (Inferred) | 229 | 3.8 | 169 | 0.5 | 0.8 | 6.0 | 28 | 1,248 | 2,452 | 3,842 | 44 |
* See footnotes under Table 1
Table 7: Central Klaza Mineral Resource Estimate, June 5, 20181,5
| Tonnes | Grade | Contained Metal | |||||||||
|---|---|---|---|---|---|---|---|---|---|---|---|
| Au | Ag | Pb | Zn | AuEQ4 | Au | Ag | Pb | Zn | AuEQ4 | ||
| (kt) | (g/t) | (g/t) | (%) | (%) | (g/t) | (koz) | (koz) | (klb) | (klb) | (koz) | |
| Indicated | |||||||||||
| Pit-Constrained2,3 | 1,260 | 3.3 | 49 | 0.6 | 0.9 | 4.3 | 133 | 1,987 | 16,414 | 25,871 | 173 |
| Underground3 | 715 | 3.9 | 62 | 0.6 | 0.7 | 5.0 | 90 | 1,432 | 9,550 | 11,309 | 114 |
| Total (Indicated) | 1,976 | 3.5 | 54 | 0.6 | 0.9 | 4.5 | 223 | 3,419 | 25,964 | 37,180 | 288 |
| Inferred | |||||||||||
| Pit-Constrained2,3 | 1,145 | 2.1 | 28 | 0.3 | 0.4 | 2.6 | 76 | 1,017 | 7,176 | 9,696 | 94 |
| Underground3 | 1,572 | 3.0 | 68 | 0.5 | 0.7 | 4.1 | 151 | 3,431 | 17,948 | 23,385 | 206 |
| Total (Inferred) | 2,717 | 2.6 | 51 | 0.4 | 0.6 | 3.4 | 227 | 4,448 | 25,124 | 33,081 | 301 |
* See footnotes under Table 1