Copyright © 2026
Rockhaven Resources
All rights reserved.
Rockhaven Resources
All rights reserved.
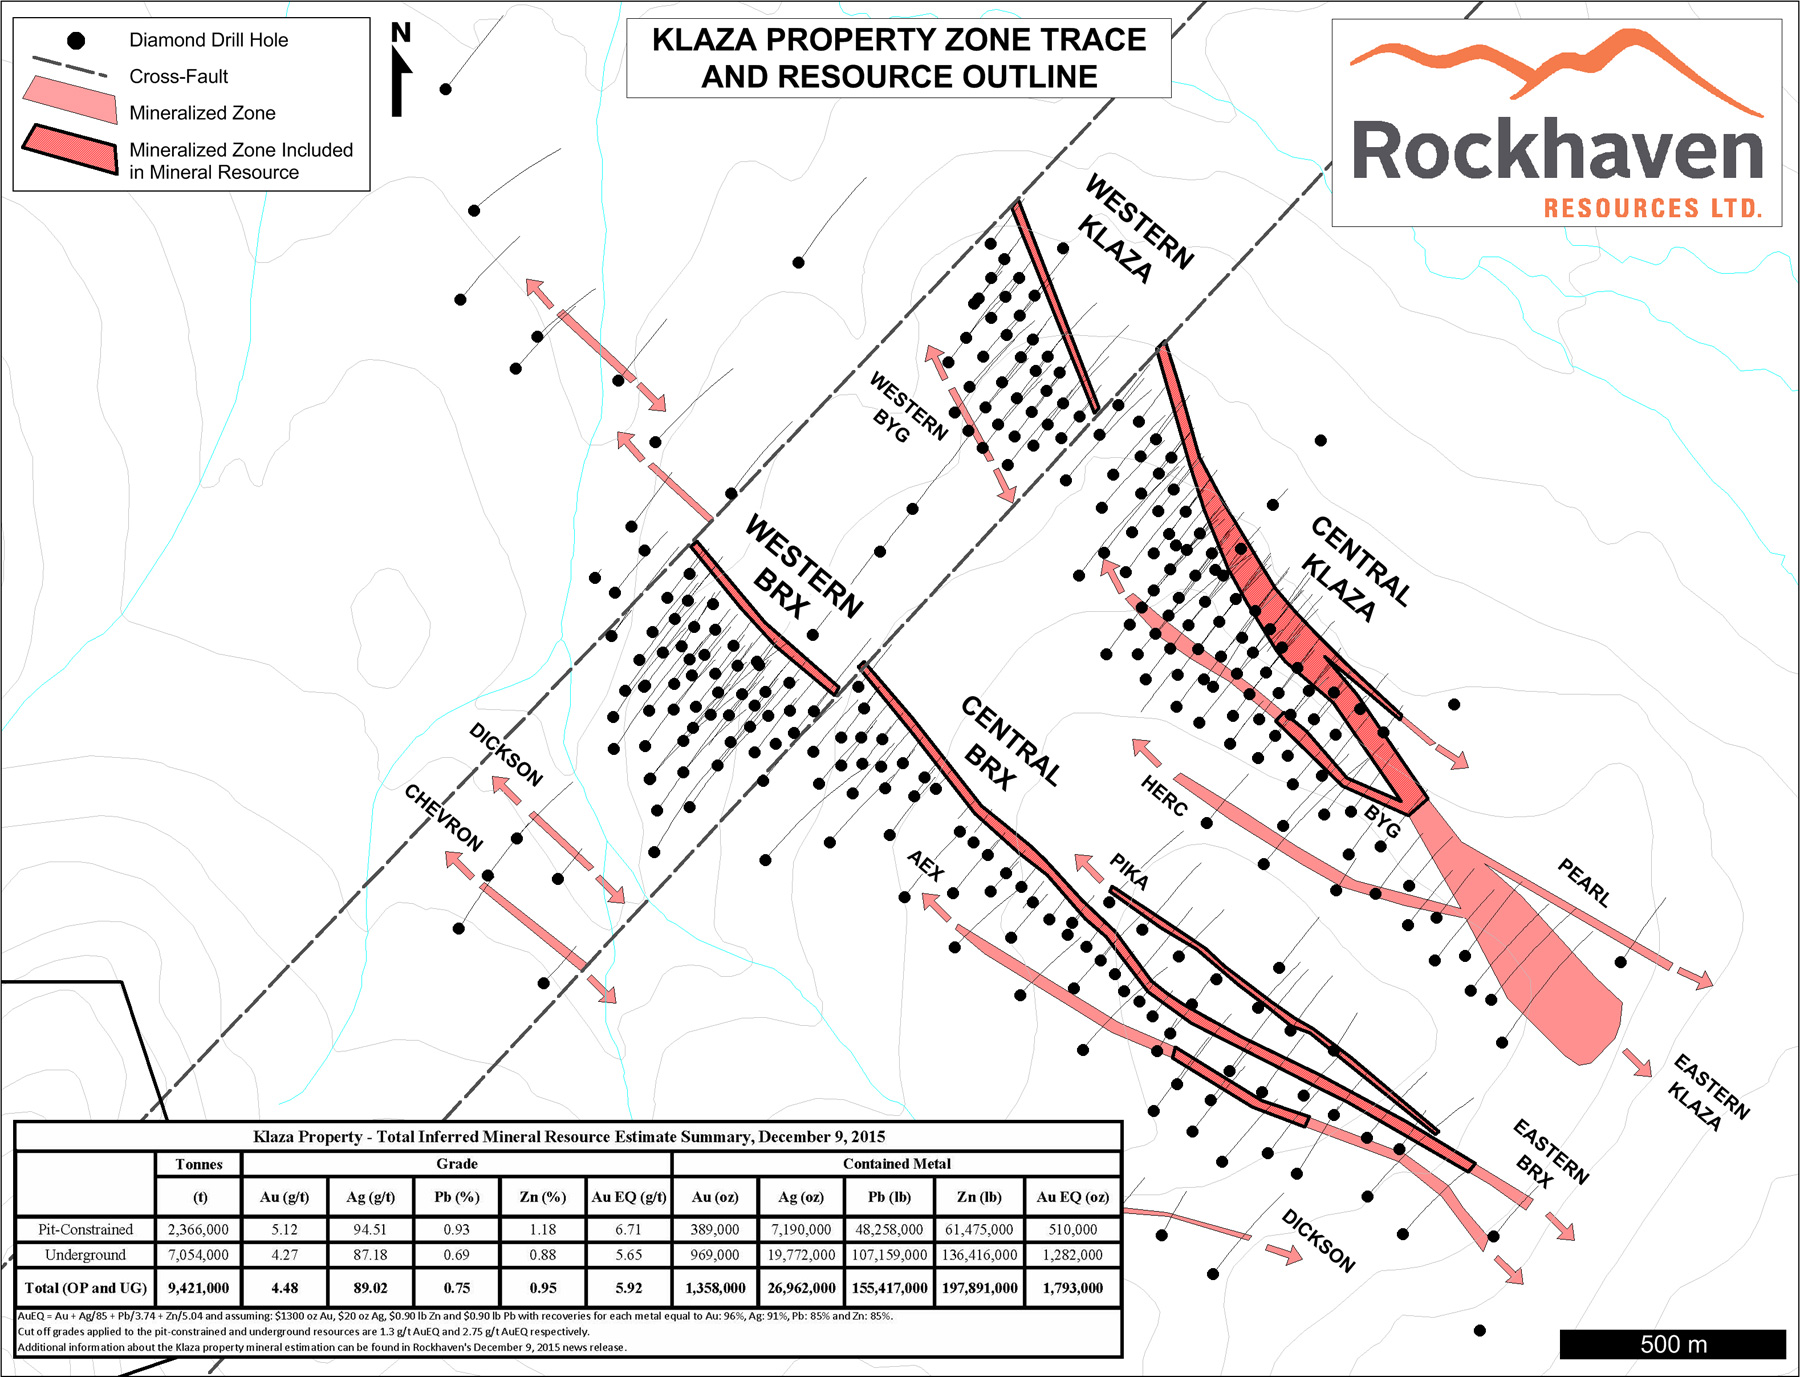
December 9, 2015 - Rockhaven Resources Ltd. (TSX-V:RK) (“Rockhaven”) is pleased to announce an updated Mineral Resource estimate for its 100%-owned and road-accessible Klaza property, located in the Dawson Range Gold Belt of southern Yukon. The updated Mineral Resource estimate incorporates results from drilling in 2015 at the Klaza and BRX zones, including the newly modelled Eastern BRX Zone and a number of subsidiary veins associated with the main structures.
The updated Mineral Resource was prepared by AMC Mining Consultants (Canada) Ltd. This new estimate comprises a total Inferred Mineral Resource of 9,421,000 tonnes grading 4.48 g/t gold, 89.02 g/t silver, 0.75% lead and 0.95% zinc, and contains 1,358,000 oz gold, 26,962,000 oz silver, 155,417,000 lbs lead and 197,891,000 lbs zinc. The Mineral Resource has a gold equivalent metal content of 1,793,000 oz at a gold equivalent grade of 5.92 g/t. Results of this Mineral Resource estimate are summarized below.
Table 1: Klaza Property - Total Inferred Mineral Resource Estimate Summary, December 9, 2015 1,5
| Tonnes (kt) |
Grade | Contained Metal | |||||||||
|---|---|---|---|---|---|---|---|---|---|---|---|
| Au (g/t) | Ag (g/t) | Pb (%) | Zn (%) | Au EQ4 (g/t) | Au (koz) | Ag (koz) | Pb (klb) | Zn (klb) | Au EQ4 (koz) | ||
| Pit-Constrained2,3 | 2,366 | 5.12 | 94.51 | 0.93 | 1.18 | 6.71 | 389 | 7,190 | 48,258 | 61,475 | 510 |
| Underground3 | 7,054 | 4.27 | 87.18 | 0.69 | 0.88 | 5.65 | 969 | 19,772 | 107,159 | 136,416 | 1,282 |
| Total | 9,421 | 4.48 | 89.02 | 0.75 | 0.95 | 5.92 | 1,358 | 26,962 | 155,417 | 197,891 | 1,793 |
1 CIM definition standards were used for the Mineral Resource.
The Qualified Person is Adrienne Ross, P. Geo. of AMC Mining Consultants (Canada) Ltd.
Using drilling results to September 30, 2015.
2 Near surface mineral resources are constrained by an optimized pit shell at a gold price of US$1300 oz.
3 Cut-off grades applied to the pit-constrained and underground resources are 1.3 g/t Au EQ and 2.75 g/t Au EQ respectively.
4 Gold equivalent values were calculated using the following formula: Au EQ=Au+Ag/85+Pb/3.74+Zn/5.04 and assuming: US$1300 oz Au, US$20 oz Ag, US$0.90 lb Pb and US$0.90 lb Zn with recoveries for each
metal of Au: 96%, Ag: 91%, Pb: 85% and Zn: 85%.
5 Numbers may not add due to rounding. Mineral resources that are not mineral reserves do not have demonstrated economic viability. All metal prices are quoted in US$ at an exchange rate of
$0.80 US to $1.00 Canadian.
“The updated Mineral Resource clearly demonstrates the potential of the road accessible Klaza deposit” stated Matt Turner, President and CEO of Rockhaven. “Deposit-wide metallurgical testing shows silver, lead and zinc are important co-products that could enhance the economics of the deposit. There is a high probability for further expansion because the mineralized zones included in the Mineral Resource are open for extension along strike and to depth and there are other parallel zones on the property that have not yet been systematically evaluated. We look forward to future exploration at Klaza with the focus of continuing to add more ounces of high-grade mineralization at a very low discovery cost per ounce.”
Compared to the Mineral Resource announced in January 2015, this represents an increase of 503,000 oz gold, using a 1.5 g/t gold-only cut-off applied to both the pit-constrained and underground components in order to directly compare at the same cut-off value. The following table summarizes the tonnage and gold ounce differences between the January and December, 2015 Mineral Resource estimates.
Table 2: Difference between January 2015 and December 2015 Inferred Gold Mineral Resources *
| Tonnes (Kt) | Au (g/t) | Contained Metal (koz Au) |
Increase in ounces (koz Au) | % Increase | |
|---|---|---|---|---|---|
| January 2015 | 7,040 | 4.19 | 948 | 503 | 53 |
| December 2015 | 10,899 | 4.14 | 1,451 |
*Details pertaining to the January 2015 Mineral Resource can be found in the Klaza Property Amended Technical Report dated June 19, 2015 which can be viewed at www.sedar.com under the Rockhaven profile or on Rockhaven’s website.
The main reasons for the differences between the current estimate and the previous estimate are additional drilling information, modelling of subsidiary structures in the Central Klaza area, and inclusion of the Eastern BRX zone into the Mineral Resource area. The Mineral Resource has also been pit-constrained with different cut-off grades for the near surface and underground mineralization.
Resource Methodology
The Mineral Resource model was re-interpreted following the successful 2015 drill program. Geological wire-frames representing high-grade veins were modeled in GEMS using available drill data. The model was constructed based upon structural controls, lithological boundaries and mineralogical domains.
A total of 71 domains were built in order to define the high-grade mineralization and different structural trends within each zone. Samples were capped for all variables within each domain where required. Block grades were estimated by Ordinary Kriging of composites within each domain. Densities of individual blocks were calculated using a regression formula based on density measurements taken and iron, lead, zinc and copper grades.
Tables showing the Mineral Resource at varying cut-off grades can be found attached. Additional tables summarizing the results of the Mineral Resource estimation for each zone can be found on Rockhaven’s website at www.rockhavenresources.com.
Metallurgy
This Mineral Resource estimate has been prepared using updated metallurgical projections shown below, which reflect ongoing improvements from testing at Blue Coast Research Ltd., and especially recent successes in enhancing the quality of the lead and zinc concentrates.
Table 3: Klaza Property - Metallurgical Projections
| Grade (%) | Recovery (%) | |||||
|---|---|---|---|---|---|---|
| Lead | Zinc | Gold | Silver | Lead | Zinc | |
| Doré | - | - | 87 | 11 | - | - |
| Lead concentrate | 60 | 3 | 4 | 53 | 85 | - |
| Zinc concentrate | 2 | 48 | 5 | 27 | - | 85 |
| Total to payable product | n/a | n/a | 96 | 91 | 85 | 85 |
The process flowsheet comprises conventional sequential flotation of lead, zinc and an arsenopyrite-enriched concentrate followed by pressure oxidation and leaching of the arsenopyrite concentrate, together with a leach of residual precious metals from the flotation tails. Precious metals are also leached from the lead concentrate to reduce gold grade sent to the smelter and increase recovery to doré. Final products from this process are precious-metal rich lead and zinc concentrates and gold as doré.
These projections are based on testwork comprising the Western Klaza, Western BRX, Central Klaza and Central BRX zones, and do not include the Eastern BRX. Ongoing metallurgical testwork is expected to demonstrate how the treatment process can be optimized to benefit from the inclusion of Eastern BRX material.
Qualified Persons
The Mineral Resource estimate was completed by AMC Mining Consultants (Canada) Ltd. Adrienne Ross, Ph.D., P.Geo., Principal Geologist with AMC is the Qualified Person for the purpose of National Instrument 43-101 for all technical information pertaining to the current Mineral Resource.
Results for the metallurgical test program were provided and approved by Chris Martin, C.Eng., of Blue Coast Metallurgy Ltd. and Qualified Person for the purpose of National Instrument 43-101.
All other technical information in this news release has been approved by Matthew R. Dumala, P.Eng., a geological engineer with Archer, Cathro & Associates (1981) Limited and Qualified Person for the purpose of National Instrument 43-101.
The Qualified Persons under the terms of National Instrument 43-101 have reviewed the technical content of this press release for the Klaza property and have approved its dissemination.
Further details supporting the geological model, estimation procedure and metallurgical testwork will be available in a National Instrument 43-101 report authored by Adrienne Ross, Ph.D., P.Geo., of AMC Mining Consultants (Canada) Ltd., Chris J. Martin, C.Eng., of Blue Coast Metallurgy Ltd. and Matthew R. Dumala, P.Eng., of Archer, Cathro & Associates (1981) Limited. The report will be posted under the Rockhaven profile at www.sedar.com within 45 days from the date of this news release.
About Rockhaven
Rockhaven Resources Ltd. is a tightly-held company focused on growth through the advancement of its Klaza project. For additional information concerning Rockhaven Resources Ltd. or its various exploration projects please visit Rockhaven’s website at www.rockhavenresources.com or contact:
Matthew Turner
President, CEO and Director
Rockhaven Resources Ltd.
T:604-687-2522
mturner@rockhavenresources.com
Neither the TSX Venture Exchange nor its Regulation Services Provider (as that term is defined in the policies of the TSX Venture Exchange) accepts responsibility for the adequacy or accuracy of this release.
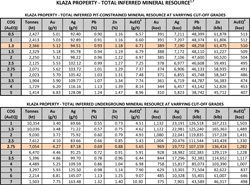
Table 4: Klaza Property – Total Inferred Pit-Constrained Mineral Resource at Varying Cut-Off Grades 1,2,4
|
COG |
Tonnes |
Au |
Ag |
Pb |
Zn |
AuEQ3 |
Au |
Ag |
Pb |
Zn |
AuEQ3 |
|
(AuEQ) |
(kt) |
(g/t) |
(g/t) |
(%) |
(%) |
(g/t) |
(koz) |
(koz) |
(klb) |
(klb) |
(koz) |
|
0.5 |
2,427 |
5.01 |
92.40 |
0.90 |
1.16 |
6.57 |
391 |
7,211 |
48,399 |
61,878 |
513 |
|
1.0 |
2,413 |
5.03 |
92.89 |
0.91 |
1.16 |
6.60 |
391 |
7,207 |
48,374 |
61,806 |
512 |
|
1.3 |
2,366 |
5.12 |
94.51 |
0.93 |
1.18 |
6.71 |
389 |
7,190 |
48,258 |
61,475 |
510 |
|
1.5 |
2,329 |
5.18 |
95.78 |
0.94 |
1.19 |
6.79 |
388 |
7,172 |
48,110 |
61,227 |
509 |
|
2.0 |
2,250 |
5.32 |
98.22 |
0.96 |
1.22 |
6.97 |
385 |
7,106 |
47,600 |
60,520 |
504 |
|
2.5 |
2,125 |
5.53 |
102.12 |
0.99 |
1.27 |
7.25 |
378 |
6,977 |
46,608 |
59,491 |
495 |
|
2.75 |
2,071 |
5.62 |
103.72 |
1.01 |
1.29 |
7.37 |
374 |
6,906 |
46,133 |
58,935 |
491 |
|
3.0 |
2,023 |
5.70 |
105.42 |
1.03 |
1.31 |
7.48 |
371 |
6,855 |
45,748 |
58,347 |
486 |
|
3.5 |
1,904 |
5.90 |
109.77 |
1.07 |
1.34 |
7.74 |
361 |
6,719 |
44,787 |
56,383 |
474 |
|
4.0 |
1,729 |
6.20 |
116.16 |
1.13 |
1.39 |
8.14 |
344 |
6,457 |
43,142 |
52,826 |
453 |
|
5.0 |
1,414 |
6.83 |
128.08 |
1.24 |
1.47 |
8.96 |
310 |
5,823 |
38,742 |
45,712 |
407 |
Table 5: Klaza Property – Total Inferred Underground Mineral Resource at Varying Cut-Off Grades 1,4
|
COG |
Tonnes |
Au |
Ag |
Pb |
Zn |
AuEQ3 |
Au |
Ag |
Pb |
Zn |
AuEQ3 |
|
(AuEQ) |
(kt) |
(g/t) |
(g/t) |
(%) |
(%) |
(g/t) |
(koz) |
(koz) |
(klb) |
(klb) |
(koz) |
|
1.0 |
10,354 |
3.40 |
69.66 |
0.55 |
0.73 |
4.51 |
1,132 |
23,191 |
126,518 |
167,211 |
1,503 |
|
1.5 |
10,036 |
3.48 |
71.22 |
0.57 |
0.75 |
4.62 |
1,122 |
22,981 |
125,240 |
165,363 |
1,489 |
|
2.0 |
9,030 |
3.72 |
75.92 |
0.60 |
0.79 |
4.93 |
1,080 |
22,041 |
119,835 |
157,228 |
1,431 |
|
2.5 |
7,612 |
4.10 |
83.66 |
0.66 |
0.85 |
5.43 |
1,004 |
20,476 |
111,544 |
143,428 |
1,330 |
|
2.75 |
7,054 |
4.27 |
87.18 |
0.69 |
0.88 |
5.65 |
969 |
19,772 |
107,159 |
136,416 |
1,282 |
|
3.0 |
6,470 |
4.46 |
91.25 |
0.72 |
0.91 |
5.91 |
928 |
18,982 |
102,383 |
129,119 |
1,228 |
|
3.5 |
5,396 |
4.86 |
99.70 |
0.78 |
0.96 |
6.44 |
844 |
17,296 |
92,381 |
114,652 |
1,117 |
|
4.0 |
4,489 |
5.25 |
109.59 |
0.86 |
1.04 |
6.98 |
758 |
15,817 |
85,073 |
103,390 |
1,007 |
|
5.0 |
3,297 |
5.93 |
125.50 |
0.98 |
1.14 |
7.90 |
629 |
13,301 |
71,504 |
82,622 |
837 |
|
6.0 |
2,214 |
6.81 |
145.07 |
1.13 |
1.25 |
9.07 |
485 |
10,328 |
55,401 |
61,007 |
646 |
|
7.0 |
1,503 |
7.75 |
163.48 |
1.32 |
1.40 |
10.30 |
375 |
7,901 |
43,589 |
46,317 |
498 |